Documentation has moved
This documentation is not maintained anymore.
Find the new documentation here:
https://support.lewe.com/docs/chart-js-for-confluence-manual/
Creating a chart from Excel
Introduction
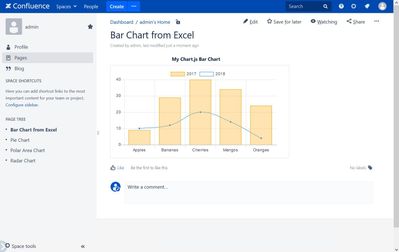
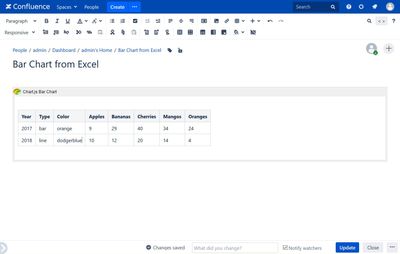
Since the Chart.js for Confluence app reads the information from tables, it is fairly simple to use an Excel table and copy it over to Confluence into a chart macro. Here is an example for a Bar Chart.
Prepare the table in Excel
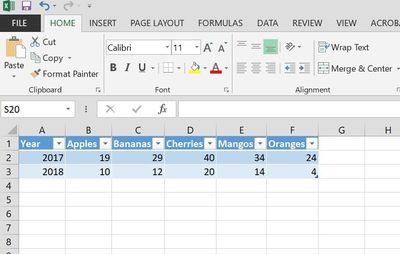
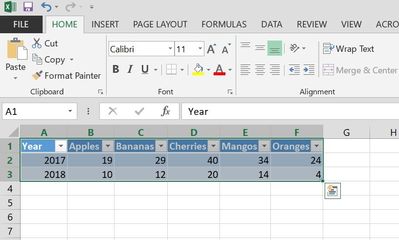
Select and copy the table
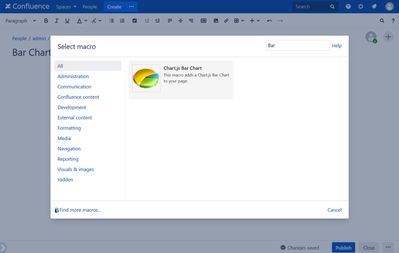
Edit your Confluence page and insert a Chart.js Bar Chart macro
Paste the Excel table from the clipboard into the macro body
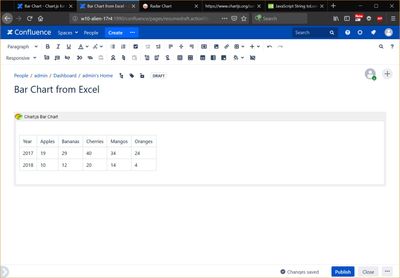
Insert a 2nd and a 3rd column
The macro expects these two columns. They allow you to specify the type and color of the data series in each row.
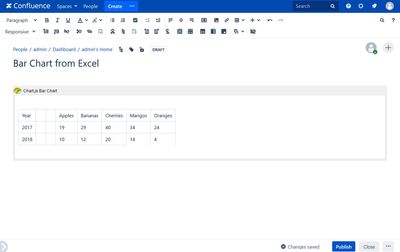
Publish your page
At this point you can already publish your page. Even though you haven't specified type and color. The macro will use defaults and random colors.
Edit your page again and fine tune your chart
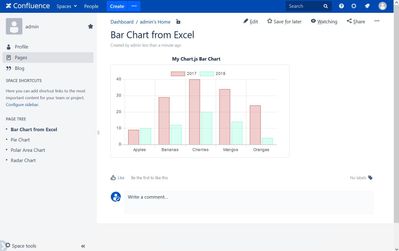
You can go back to your macro and specify more details.
Final result after publish